We tasted chocolates. We were ten tasters: Justin, Sydnor, Lizzie, Adrienne, Nicole, Andy, John, Bill, Jonah, and me—Michael. I asked each taster to bring a bar of “fair trade” chocolate; most people brought dark chocolate which at least claimed to be fairly traded. We had 16 chocolates: 13 dark, 3 with dairy (samples A, L, and M). All but 2 of the chocolates were plain bars: one had cocoa nibs (sample G), and another wasn’t bar shaped (sample F).
The methodology was slightly convoluted and didn’t completely blind the tasting. Lizzie chopped the chocolates, put them on plates with distinguishing markings facing down, and numbered each plate 1 through 16. (Thanks Lizzie!) Sydnor then randomly switched the numerical labels for alphabetical labels, A through P. (Thanks Sydnor!) Lizzie did a remarkably good job of camouflaging bars, but some bars retained their distinctive texture or markings. That said, the group was willing to avoid open speculation about which bar was which. In addition to making tasting notes, tasters assigned each chocolate a rating between 1 (out of my mouth!) and 5 (platonic ideal of chocolate), with tasters freely using decimal ratings, continued fractions, etc. Tasters split into small groups: Nicole, Adrienne, and Andy; Justin, Bill, John, and Sydnor; Jonah, Lizzie, and I.
| Sample key | |||||
|---|---|---|---|---|---|
| A | B | C | D | ||
| Alter Eco Dark Velvet* |
Madecasse Rich & Fruity | Endangered Species Dark | Trader Joe’s Dark | ||
| E | F | G | H | ||
| Theo Organic Dark | Taza† | Mast Bros. Cocoa Nibs‡ | Trader Joe’s Dark Fair Trade | ||
| I | J | K | L | ||
| Mast Bros. Brooklyn Blend | Alter Eco Dark Blackout | Equal Exchange Very Dark | Endangered Species Milk* | ||
| M | N | O | P | ||
| Trader Joe’s Milk Fair Trade* | 365 Dark | Pure Icelandic Noi Sirius | Cote d’Or Noir Intense | ||
| * Contains milk † Round, not bar shaped ‡ Contains cocoa nibs |
|||||
The raw ratings are available in CSV; the tasting notes are available in TXT (mildly preprocessed: tasters aggregated, one line per sample). Statistical amateur hour follows.
Tasters did not rate surjectively: many tasters never gave a 5, while Andy never gave anything a 1. Supposing that a taster “likes” something they rate at 3 or above, here is the breakdown (graphs are clickable). The samples are on the x-axis; the y-axis is the number of “likes”.
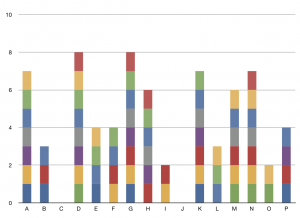
Sorting chocolates by popularity, we find:
- TJ’s Dark (D), Mast Bros. Cocoa Nibs (G) (8 likes)
- Alter Eco Dark Velvet (A), Equal Exchange Very Dark (K), 365 Dark (N) (7 likes)
- TJ’s Dark Fair Trade (H), TJ’s Milk Fair Trade (M) (6 likes)
- Theo Organic Dark (E), Taza (F), Cote d’Or Noir Intense (P) (4 likes)
- Madecasse Rich & Fruity (B), Endangered Species Milk (L) (3 likes)
- Mast Bros. Brooklyn Blend (I), Pure Icelandic Noi Sirius (O) (2 likes)
- Endangered Species Dark (C), Alter Eco Dark Blackout (J) (0 likes)
To my mind, the moral of the story is that supermarket brands are inoffensive: TJ’s and the Whole Foods 365 brand both ranked near the top. The Mast Bros. bar was the highest rated “boutique” bar. I didn’t like it much but 8 out of 10 tasters did—so what do I know.
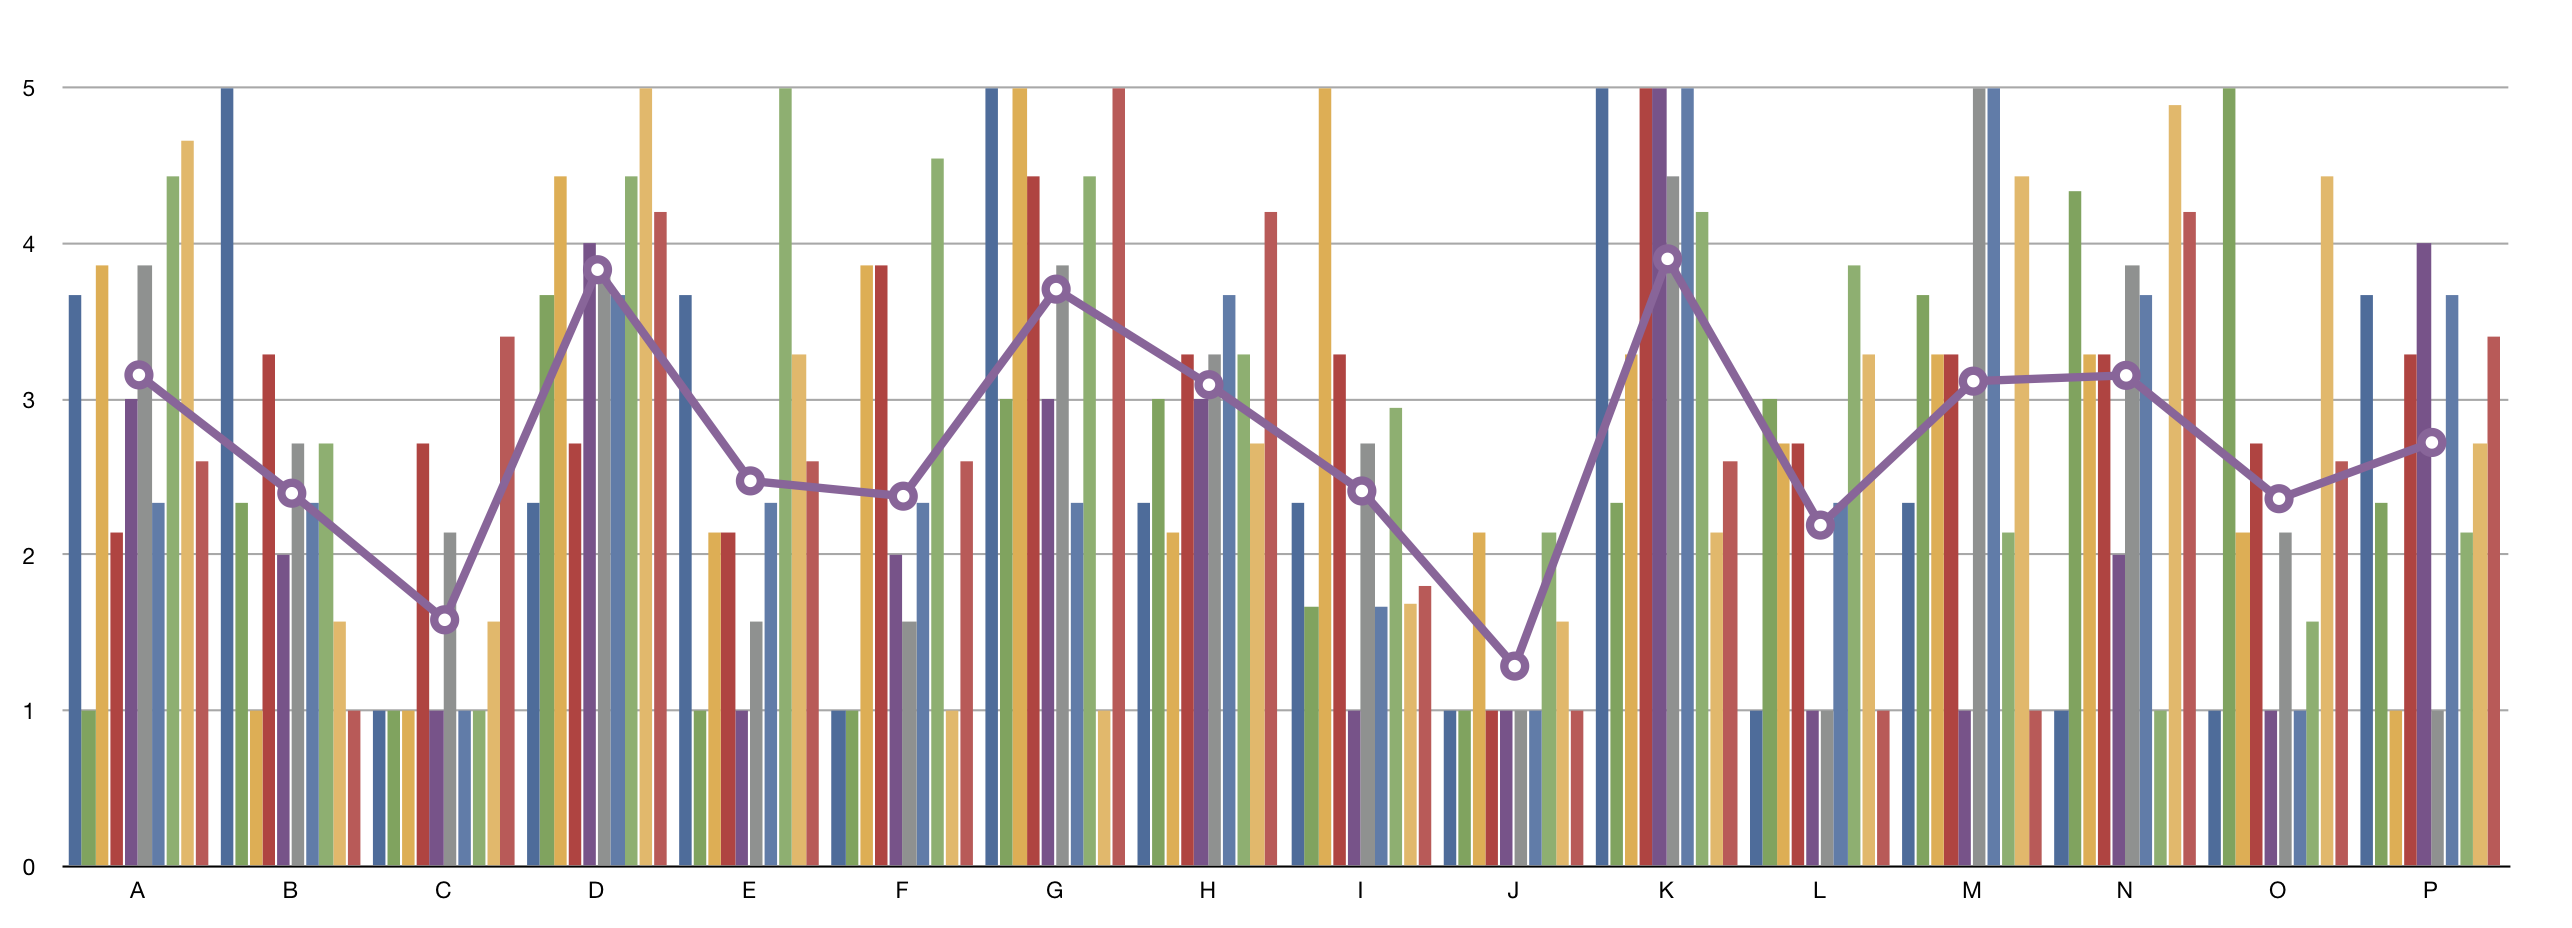
Linearly normalizing tasters to their own range of scores, the full results are below. The taster colors in the legend match the cumulative bar chart of “likes” above. Again, samples are on the x-axis, and the y-axis are the ratings.
![]()
Looking at inter-taster effects, k-means with k=3 isolates two pairs of tasters with fairly divergent palates: Sydnor and John’s tastes are plotted in blue, while Bill and mine are in red; everyone else is plotted in green, and the mean over all tasters is in black. The axes are the same as the previous graph.
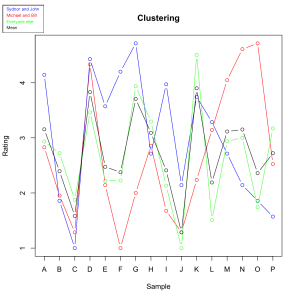
The four of us deviated a fair bit from the mean, yet Bill and I rarely agreed with John and Sydnor. The points where we did agree are telling: the universally despised Endangered Species Dark and the not-much-better Madecasse Rich & Fruity; the classic Trader Joe’s Dark and Dark Fair Trade, the caramelly and accessible Endangered Species Milk. I don’t think the root cause is differences in perception, since our notes often read similarly: John, Bill, and Sydnor all mentioned coconut in their notes on sample O; we all agreed that Taza was “like putting playground sand in [our] mouth[s]”, but some of us enjoyed the “interstitial delights” while others didn’t. De gustibus non est disputandum. Or at least I hope not—Sydnor and Bill are married.
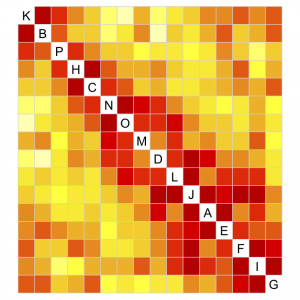
I’m not sure what to make of this heatmap, but a statistician friend of mine recommended making it (thanks for the help Justin!), and it certainly looks cool. Darker reds indicate higher positive correlation; lighter yellows indicate anticorrelation. Yes, I know this is the wrong way to do it if the diagonal is white.
All of this aside, I suspect that there was a strong “considered taste” effect. Normally, we are happy to say that chocolate is chocolate, and it goes in the mouth. Considered next to each other, though, each chocolate’s idiosyncrasies and—let’s not be coy—flaws fall into clearer relief.
I didn’t get what I wanted out of this taste test: a clear winner. I found instead that:
- 16 samples is way too many,
- chocolate can taste like “poop dirt” (thanks, Nicole!), and
- disgusting chocolate still makes great devil’s food cake (happy birthday, Kelly!).
In the end, I doubt I’ll return to Chocodome: 16 bars enter, ten tasters leave… unpleasantly full and distressingly caffeinated. A square or two after dinner will suit me just fine.
Update: I’ve also done some analysis by gender.